
Reporting Issues
When SAM misbehaves, you can report it without leaving the app. This page covers the reporting flow for everyday users, then the operator-side setup that makes it work.
Reporting a problem
Section titled “Reporting a problem”There are two ways in.
From a chat session
Section titled “From a chat session”Use this when an agent did something wrong — got stuck, produced bad output, lost its work, failed to start.
The Report action lives in the session tool rail, down the right edge of the chat:
- In the chat, find the tool rail on the right.
- Click Report (the flag icon).
Report stays in the rail after a session stops or fails, so you can still report a session that already ended — which is usually when you want to. For the rest of the rail, and for switching it between icons, labels, and hidden, see The session tool rail.
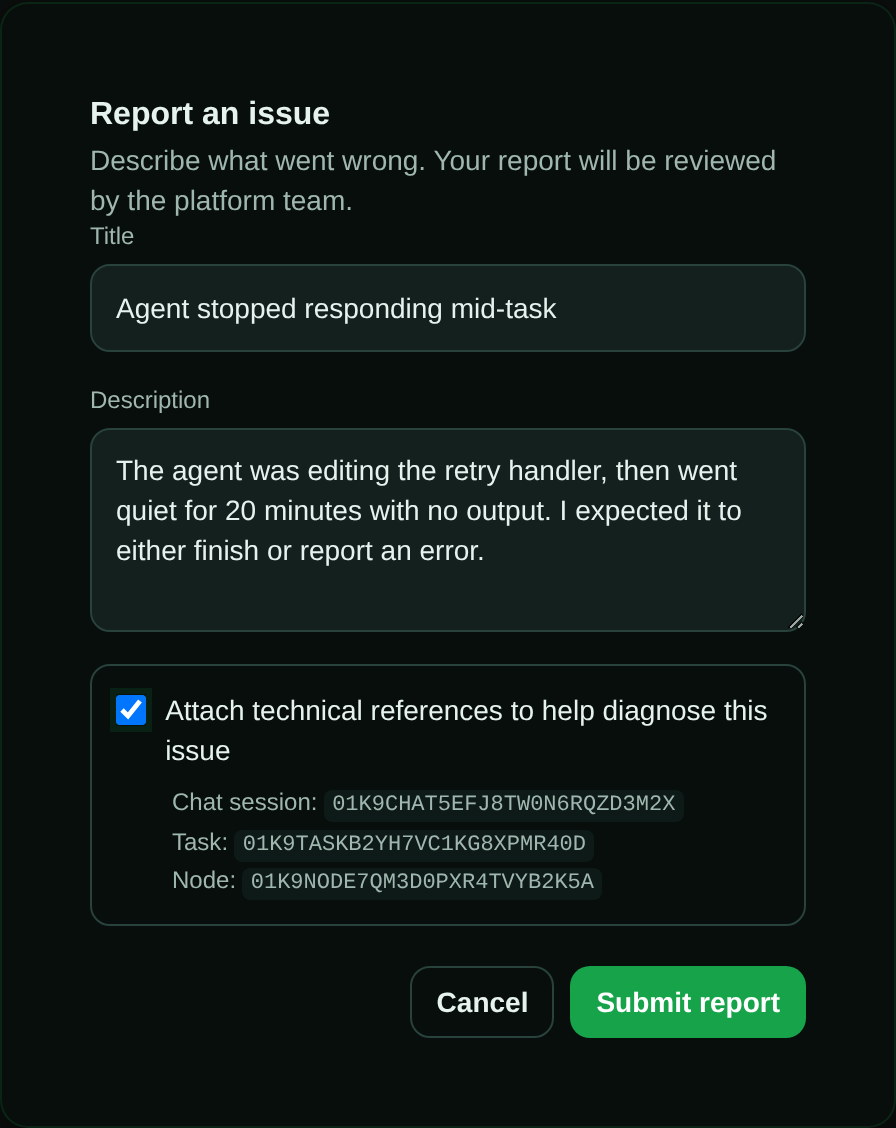
Shown with the consent box ticked so the identifier list is visible. It is unchecked by default.
From a crash screen
Section titled “From a crash screen”If the UI itself crashes, the error screen offers a Report this issue link. Use this when a page went blank or threw an error rather than the agent misbehaving.
Either way you get the same dialog: a title, a description, and — when SAM has context to offer — a consent checkbox.
What gets attached, and only if you say so
Section titled “What gets attached, and only if you say so”SAM never attaches technical context silently. The dialog shows an unchecked box:
Attach technical references to help diagnose this issue
Tick it and SAM lists the exact identifiers it would send, so you can see them before you submit:
| Reference | Where it comes from | Checked against your access? |
|---|---|---|
| Chat session | The session you’re reporting from | Yes — must be your workspace |
| Task | The task backing that session | Yes — must be your project |
| Node | The machine the workspace was running on | Yes — must be your node |
| Error | The crash screen’s error text | No — see below |
Reporting from a chat session offers the first three; the crash screen offers the error reference. (The API also accepts a Diagnosis reference for a superadmin deployment diagnosis, but no screen currently supplies one.)
These are identifiers only — SAM does not ship your code, your transcript, or your environment. They let a maintainer look up the right records rather than guess from a description.
The Error reference is the odd one out. It is taken from the crash text your browser produced, but the server only accepts identifier-shaped values — letters, digits, and . _ : -, with no spaces. Most real error messages contain spaces or punctuation, so in practice this reference is usually dropped rather than attached. Describe the error in your own words; don’t count on it coming along.
Leave the box unchecked and only your title and description are submitted. The report still gets filed.
Two things happen server-side regardless of what you tick:
- Ownership is re-checked. Session, task, node, and diagnosis references are verified against your access before they’re stored, and silently dropped if you don’t have it — a stale or copied identifier can’t pull someone else’s records into your report. The error reference is not looked up, because it isn’t a pointer to a stored record. The confirmation screen lists what was actually attached, which may be fewer references than the dialog offered — and lists none at all if everything was dropped.
- Everything is scrubbed — your title, your description, and each attached reference. Best-effort redaction strips credential-shaped strings (API keys, tokens,
sk-/ghp_-style prefixes, PEM private key blocks) and email addresses before anything is stored, so a secret that leaked into an error message doesn’t ride along. Treat it as a safety net, not a licence — don’t paste secrets into the box.
After you submit
Section titled “After you submit”You get a confirmation with a report ID, a status of draft, and the list of references that were actually attached. The report becomes a draft Idea in the platform’s feedback project, where a maintainer picks it up.
Reports are rate-limited to 20 per hour per account (RATE_LIMIT_REPORT_ISSUE_POST). Exceeding that returns a 429. The window is a fixed clock hour rather than a rolling sixty minutes, so the allowance resets at the top of the next hour — which may be in five minutes or fifty-five.
Length limits: title 200 characters, description 5,000 characters. The dialog enforces both as you type, so you’ll notice the cap rather than lose text on submit.
Don’t see a Report button?
Section titled “Don’t see a Report button?”The feature is hidden entirely unless the deployment has been configured with a feedback project. If neither entry point appears, this deployment hasn’t set one up — report through whatever channel your operator uses instead. On a self-hosted SAM, that operator is you; see below.
For operators: where reports land
Section titled “For operators: where reports land”Reports are filed as draft Ideas in one project you nominate:
- Create or choose a project for platform feedback.
- Open Admin → Integrations (
/admin/integrations). - Choose that project under Private feedback project and save.
The saved runtime setting is stored in platform_settings and takes precedence without a redeploy. PLATFORM_FEEDBACK_PROJECT_ID=<project id> remains available as a bootstrap/environment fallback for first deploys and automation. SAM validates the effective project on every check — if no runtime setting or environment fallback exists, or the effective project doesn’t exist, GET /api/report-issue/config returns enabled: false and both entry points disappear from the UI. This is deliberate: an unconfigured deployment shows no button rather than a button that errors.
The same project also receives automated error triage, so pick one you’ll actually watch — a dedicated “Platform Feedback” project works well.
Report limits
Section titled “Report limits”| Variable | Default | Description |
|---|---|---|
PLATFORM_FEEDBACK_PROJECT_ID | unset | Bootstrap/environment fallback for the feedback project. The Admin → Integrations runtime selection is preferred and overrides it. |
REPORT_ISSUE_TITLE_MAX_LENGTH | 200 | Truncation ceiling for the stored title — see below |
REPORT_ISSUE_DESCRIPTION_MAX_LENGTH | 5000 | Truncation ceiling for the stored description — see below |
REPORT_ISSUE_CONTENT_MAX_LENGTH | 65536 | Max stored Idea body, including attached references |
RATE_LIMIT_REPORT_ISSUE_POST | 20 | Report submissions allowed per clock hour, per user |
How a report is stored
Section titled “How a report is stored”Every report first enters a private grouped incident backlog keyed by a redacted content signature. Repeated reports update the same grouped incident and its existing draft Idea instead of creating one Idea per occurrence.
The draft Idea body is written in a three-part structure that keeps maintainer instructions separate from user-supplied text:
| Section | Contents |
|---|---|
## Maintainer Instructions | SAM’s own triage instructions, plus an explicit security boundary statement |
## Trusted Metadata | The identifiers the reporter consented to attach, one per line |
## Untrusted Evidence: User Report Description | The reporter’s own words, redacted and wrapped in a Markdown code fence |
That fence matters when you point an agent at the resulting Idea. The reporter’s description is external input, and treating it as instructions would be a prompt-injection channel straight into a maintainer’s agent. The format tells the agent explicitly which parts are yours and which are the reporter’s. SAM’s default “execute idea” prompt template carries the same warning; if you override it with VITE_EXECUTE_IDEA_PROMPT_TEMPLATE, keep that instruction.
For operators: automated error triage
Section titled “For operators: automated error triage”Beyond user-submitted reports, SAM files its own reports. Once an hour it groups recent platform errors and warnings, prioritizes severe and novel signatures ahead of low-severity repeat floods, runs the deployment diagnosis agent on a representative error from each eligible group, and writes a grouped incident plus draft Idea into the same feedback project.
Grouping is by a redacted content signature, so a recurring error updates its existing incident/Idea instead of filing a new one every hour. A group that fails triage repeatedly is rejected rather than retried forever. Budget exhaustion is different: daily token exhaustion, per-run token exhaustion, and similar capacity blocks are persisted as retryable deferrals. Deferred signatures stay pending, are skipped until their retry time, and become eligible again after the budget refresh instead of being permanently rejected. Errors emitted by tasks in the feedback project are excluded from the hourly grouping pass so an incident-handling agent cannot recursively file incidents about its own failures.
The private incident backlog has its own queue state (pending, dispatched, claimed, resolved, rejected, expired). By default, when dispatchable incidents exist and no incident trigger exists in the feedback project, SAM creates one private incident trigger automatically. Existing operator-created incident triggers, including paused ones, are respected. Incident triggers dispatch one investigation-only agent for a bounded backlog summary, not one agent per occurrence. Pending signatures already associated with open tracked work (idea_id, a diagnosis-linked Idea, or resolved_by_task_id) stay attached to that work and are skipped by automatic dispatch. Warning-only signatures stay available for linkage/review but do not consume VM dispatches unless the severity floor is lowered. Agents then use private MCP tools (list_incident_queue, get_incident, claim_incident, resolve_incident) to claim and terminally resolve incidents. A resolved incident must carry a structured ship-or-track reference: fixPrUrl for a merged/open PR, dispatchedTaskId for a separate implementation task, or linkedRecordId for an existing Idea/task. Rejections require a justification note instead. Those tools are server-scoped to the effective feedback project setting; they return only bounded, redacted evidence and explicitly label report/log/diagnosis text as untrusted. Machine-generated feedback and diagnostics should stay private and must not be copied into public GitHub issues.
There is no UI button for triage yet. A superadmin can POST /api/admin/observability/feedback-triage to sweep immediately rather than waiting for the next hourly run. Note that a manual sweep still only looks back over PLATFORM_FEEDBACK_TRIAGE_WINDOW_MINUTES (60 minutes by default), so it will not surface older errors — to test a fresh configuration, trigger it while a recent error is still inside that window.
| Variable | Default | Description |
|---|---|---|
PLATFORM_FEEDBACK_TRIAGE_WINDOW_MINUTES | 60 | Lookback window for grouping recent errors |
PLATFORM_FEEDBACK_TRIAGE_ERROR_LIMIT | 100 | Max error rows scanned per sweep |
PLATFORM_FEEDBACK_TRIAGE_GROUP_LIMIT | 5 | Max grouped candidates processed per sweep |
PLATFORM_FEEDBACK_TRIAGE_EVIDENCE_LIMIT | 10 | Max error references retained per group |
PLATFORM_FEEDBACK_TRIAGE_CLAIM_TTL_MS | 600000 | Claim lease before a later sweep can reclaim a group |
PLATFORM_FEEDBACK_TRIAGE_MAX_FAILURES | 3 | Failed attempts before a group is rejected |
PLATFORM_FEEDBACK_TRIAGE_FAILURE_REASON_MAX_LENGTH | 240 | Max characters stored for a sanitized failure reason |
PLATFORM_FEEDBACK_TRIAGE_BUDGET_DEFER_MS | 86400000 | Retry delay for per-run budget deferrals |
PLATFORM_FEEDBACK_INCIDENT_DISPATCH_LEASE_TTL_MS | 7200000 | Dispatch lease before a failed trigger handoff can be reclaimed |
PLATFORM_FEEDBACK_INCIDENT_AGENT_LEASE_TTL_MS | 3600000 | Agent claim lease before another task can reclaim an incident |
PLATFORM_FEEDBACK_INCIDENT_MAX_DISPATCH_ATTEMPTS | 3 | Agent-reported failed dispatch attempts before an incident is rejected |
PLATFORM_FEEDBACK_INCIDENT_REOPEN_COOLDOWN_MS | 1800000 | Minimum elapsed time after resolution/expiry before a newer occurrence can reopen the signature; set 0 to disable cooldown-only suppression |
PLATFORM_FEEDBACK_INCIDENT_RECLAIM_LIMIT | 25 | Max expired dispatch leases reclaimed by one incident sweep |
PLATFORM_FEEDBACK_INCIDENT_MAX_AGE_MS | 2592000000 | Max active incident age before expiry |
PLATFORM_FEEDBACK_INCIDENT_STALE_SINGLETON_MAX_AGE_MS | 259200000 | Max age for one-off pending incidents with no recurrence |
PLATFORM_FEEDBACK_INCIDENT_STALE_SINGLETON_EXPIRY_BATCH_SIZE | 25 | Max stale singleton incidents expired per sweep |
PLATFORM_FEEDBACK_INCIDENT_MIN_DISPATCH_SEVERITY | error | Minimum severity admitted to automatic VM incident dispatch |
PLATFORM_FEEDBACK_INCIDENT_MIN_DISPATCH_BATCH_SIZE | 2 | Dispatch immediately once this many eligible incidents are ready |
PLATFORM_FEEDBACK_INCIDENT_MIN_PENDING_AGE_MS | 1800000 | Dispatch a smaller eligible batch after this pending age |
PLATFORM_FEEDBACK_INCIDENT_DISPATCH_RATE_WINDOW_MS | 3600000 | Rate-cap window for each incident trigger |
PLATFORM_FEEDBACK_INCIDENT_MAX_DISPATCHES_PER_TRIGGER_WINDOW | 1 | Max dispatches one incident trigger may submit per rate window |
PLATFORM_FEEDBACK_INCIDENT_AUTO_TRIGGER_ENABLED | true | Auto-create one private incident trigger when needed |
PLATFORM_FEEDBACK_INCIDENT_TRIGGER_LIMIT | 5 | Max active incident triggers inspected per sweep |
PLATFORM_FEEDBACK_INCIDENT_TRIGGER_NAME | built-in | Name for the auto-created private incident trigger |
PLATFORM_FEEDBACK_INCIDENT_TRIGGER_TEMPLATE | built-in | Prompt template for the auto-created private incident trigger |
PLATFORM_FEEDBACK_INCIDENT_SUMMARY_LIMIT | 10 | Max incidents in one trigger backlog summary |
PLATFORM_FEEDBACK_INCIDENT_EVIDENCE_REF_LIMIT | 10 | Max evidence references retained per incident |
PLATFORM_FEEDBACK_INCIDENT_EVIDENCE_MAX_BYTES | 32768 | Max serialized evidence bytes per incident |
PLATFORM_FEEDBACK_INCIDENT_RESOLUTION_NOTE_MAX_LENGTH | 2000 | Max private resolution-note length |
Resolved and expired incident signatures reopen only when a newer occurrence arrives after PLATFORM_FEEDBACK_INCIDENT_REOPEN_COOLDOWN_MS; older lookback-window occurrences remain closed. VM-agent incidents resolved with fix evidence also wait for occurrences from nodes reporting the current VM_AGENT_REQUIRED_VERSION, because Worker deploys do not update already-running VM binaries. Dispatch attempts are consumed only when the incident task reports its own failure; platform-side handoff/session failures release the dispatch without incrementing dispatch_attempts. Automatic incident dispatch ignores pending signatures already linked to open tracked work and warning-only signatures below the configured severity floor, then applies the batch/age gate and per-trigger rate cap before reserving incidents.
Automated triage and superadmin-initiated diagnosis have separate daily token budgets. They read the same DEBUG_AGENT_DAILY_TOKEN_LIMIT value but count against independent per-feature counters, so a noisy hour of triage can never eat the allowance a superadmin wants for hands-on diagnosis. Budget accordingly: with triage enabled, worst-case daily spend on diagnosis is twice DEBUG_AGENT_DAILY_TOKEN_LIMIT. To cap triage specifically, lower PLATFORM_FEEDBACK_TRIAGE_GROUP_LIMIT or PLATFORM_FEEDBACK_TRIAGE_ERROR_LIMIT. When automated triage hits its daily budget, it defers the current signature until the next UTC day; per-run budget exhaustion uses PLATFORM_FEEDBACK_TRIAGE_BUDGET_DEFER_MS.
For superadmins: diagnosing errors with an agent
Section titled “For superadmins: diagnosing errors with an agent”Admin → Errors can hand an error to an AI agent for analysis.
- Diagnose on a single error row — analyze one specific failure.
- Diagnose window — analyze everything in the current filter. Windows longer than 24 hours are clamped, and the button relabels itself Diagnose latest 24h so you know what you’re actually getting.
The agent reads bounded, redacted evidence — recent errors, a health summary, error trends, Worker logs, and related entity state — and returns a written analysis. The panel shows the model, turn count, tokens for that run, and your usage against the daily budget.
Diagnosis runs are durable. Starting one returns immediately and the work continues server-side, so closing the tab doesn’t kill it. A Recent diagnosis runs card lists the last several runs with their status (queued, running, succeeded, failed, cancelled); an in-flight run is marked recoverable after refresh and can be cancelled at a durable checkpoint. Failed runs can be retried from the card, while failed or cancelled runs can be retried from their detail page.
When a diagnosis is worth keeping, Save as draft Idea files it into a project you choose so it becomes tracked work instead of a panel you have to leave open.
What the agent is not allowed to see
Section titled “What the agent is not allowed to see”/admin/errors is superadmin-only and its raw rows can contain local user IDs, IP addresses, and user-agent strings. Before any tool result reaches the model, SAM recursively strips those fields plus credential-shaped values — API tokens, JWTs, authorization headers, private keys, and long secret-like strings. Cloudflare credentials stay server-side and never enter model messages or saved diagnosis text.
The same redactor now also runs on the Worker log query behind /admin/logs, over each entry’s details object. So a superadmin browsing logs directly will see [REDACTED] in place of values — including user_id, ip_address, and user_agent, which are correlation fields rather than secrets. That is expected, not a bug. It does not cover an entry’s message text, so treat log messages as unredacted.
Automatic VM diagnostic evidence
Section titled “Automatic VM diagnostic evidence”For VM Agent failures, the error row can include a Diagnostic evidence card. The VM Agent assigns one stable incident ID, durably queues the error, and collects a small same-installation snapshot while it retries delivery. The Worker deduplicates repeated VM incidents by redacted signature and deployment: after the first occurrence, later repeats update occurrence count and last-seen time instead of creating another incident row or R2 artifact. The snapshot is deliberately narrower than a debug package:
- allowlisted runtime health, agent version, bounded system resources, structured event metadata, and workspace lifecycle state;
- recursive credential-shaped value redaction plus depth, item, string, document, archive, spool, and retention limits;
- no repository files, arbitrary filesystem reads, environment dumps, shell history, raw command output, session transcript, or cross-installation transport.
The redacted preview is stored in D1. Compressed bytes remain in the deployment’s private R2 bucket and are streamed only through a superadmin-authenticated download route; SAM never returns the R2 object key or a direct object URL to the browser or diagnosis model. The card shows pending, available, failed, expired, or missing explicitly, including collector failures and truncation/redaction counts. A pending upload is not presented as complete.
The diagnosis agent gets only the bounded redacted preview through its read-only incident tool. Downloading the private archive is a separate human action. Collect debug package remains a separate, explicit, broader live-node action and is never run automatically or exposed to the diagnosis model.
Diagnosis limits
Section titled “Diagnosis limits”| Variable | Default | Description |
|---|---|---|
DEBUG_AGENT_MODEL | @cf/zai-org/glm-5.2 | Workers AI model used for diagnosis |
DEBUG_AGENT_MAX_TURNS | 6 | Max model/tool turns per diagnosis |
DEBUG_AGENT_RUN_TOKEN_LIMIT | 96000 | Combined token ceiling per diagnosis |
DEBUG_AGENT_MODEL_OUTPUT_TOKENS | 4096 | Max output tokens per model turn |
DEBUG_AGENT_DAILY_TOKEN_LIMIT | 480000 | Daily budget, counted per feature — manual diagnosis and automated triage each get this much |
DEBUG_AGENT_TOOL_RESULT_LIMIT | 50 | Max rows returned by a diagnosis tool |
DEBUG_AGENT_TOOL_RESULT_BYTES | 32768 | Max serialized bytes per model-visible result |
DEBUG_AGENT_MAX_WINDOW_HOURS | 24 | Max selectable diagnosis window |
DEBUG_AGENT_TIMEOUT_MS | 120000 | Timeout per diagnosis model request |
DEBUG_AGENT_HARD_DEADLINE_MS | 900000 | Hard deadline after which an active diagnosis is terminalized |
DEBUG_AGENT_STALE_HEARTBEAT_MS | 120000 | Stale heartbeat threshold used by the orphan reconciler |
DEBUG_AGENT_RETRY_BASE_DELAY_MS | 2000 | Initial classified transient retry delay |
DEBUG_AGENT_RETRY_MAX_DELAY_MS | 60000 | Maximum classified transient retry delay |
DEBUG_AGENT_STEP_MAX_RETRIES | 3 | Maximum transient retries for one checkpointed step |
For superadmin-initiated diagnosis, exhausting the daily budget does not block the request up front — the run is accepted, then fails with “Daily deployment debugging budget exhausted” and appears in Recent diagnosis runs as failed. Its Retry button will keep failing until the next day. Automated triage handles the same budget condition as a retryable deferral, as described above.
See the Configuration Reference for the complete variable list.